High Steaks! Beef Learning Unit (9-12th Grade)
Author
Published
12/4/2020
Target Grade Level / Age Range:
9-12th
Estimated Time:
- Activity 1: Cattle Genetics (45 minutes)
- Activity 2: Cattle and Carbon (45 minutes)
- Activity 3: Global Food Networks (45 minutes)
- Activity 4: Beef Nutrition (45 minutes)
- Activity 5: Beef Marketing (90 minutes)
Purpose:
Students will understand beef production, nutrition, and marketing, through interactive activities, projects, and resources.
Materials:
- Activity 1 – Cattle Genetics
- Coins
- Calculators
- White Board
- Dry Erase Markers
- Activity 2 – Cattle and Carbon
- Tape or Magnets
- White Board
- Dry Erase Markets
- Writing Utensil and Paper/Student Computers
- Activity 3 – Global Food Networks
- Iowa Ag Today, Issue 6 (Middle School Version). Available digitally in “Essential Files”
- Writing Utensil and Paper
- Activity 4 – Beef Nutrition
- Beach Ball/Soccer Ball
- Marker
- Activity 5 – Beef Marketing
- Digital art software - Paint, Publisher, Canva, etc. (optional)
- Word processor or similar (i.e. MS Word, Google Docs, etc.)
Essential Files:
- Interest Approach
- Activity 1: Cattle Genetics
- Activity 2: Cattle and Carbon
- Activity 3: Global Food Networks
- Activity 4: Beef Nutrition
- Activity 5: Beef Marketing
Vocabulary:
- Phenotype – observable traits or characteristics of an organism
- Genotype – the genetic constitution of an organism
- Genetic Variation – the differences in DNA sequences between individuals within a population
- Mutation – a change in the DNA sequence of an organism
- Gamete – a reproductive cell of an animal or plant. In cattle, female gametes are called ova or egg cells; male gametes are called sperm. Both are haploid cells that can unite with another cell of the opposite sex in sexual reproduction to form a zygote.
- Allele – a variant form of a gene
- Probability – the likelihood an event would happen
- Heterozygous – having different alleles for a trait
- Homozygous – having the same alleles for a trait
- Carbon – a chemical element that is found in all living organisms
- Photosynthesis – the process in which green plants, algae, and some bacteria convert light into energy
- Market (n) – a system that facilitates the trade of goods and services regulated by supply and demand
- Market (v) – advertise or promote
Background – Agricultural Connections:
This unit is designed for students in grades 9-12 to explore beef production, nutrition, and marketing. It is part of a scaffolded series with lessons for grades 3-5 and 6-8, which can be found at Iowa Agriculture Literacy Foundation.
The unit consists of five activities, each lasting 45 minutes, with the final project extending to 90 minutes.
- Activity One: Uses cattle genetics to explore breeding choices by farmers/ranchers
- Activity Two: Explores the role of beef cattle in the carbon cycle and how they are raised.
- Activity Three: Examines the global food network with an emphasis on cattle.
- Activity Four: Engages students in critical thinking about beef and its plant counterparts.
- Activity Five: Prompts students to develop their own High Steaks! Beef Marketing Projects, where they will create advertisements for a beef product.
Cattle play an essential role in agriculture, but they also contribute to greenhouse gas emissions. As ruminants, cows naturally produce methane due to trillions of microbes in their rumen. The U.S. has approximately 32 million beef cows, and cattle account for about 2% of national greenhouse gas emissions.
There are common misconceptions about methane emissions from cattle like how methane produced by cattle primarily enters the atmosphere (burping/exhaling produces the majority of methane) and that differing production methods have a large impact on methane emissions (High-fiber, forage-based diets result in greater methane production, while grain-fed cattle produce less methane and reach market weight faster, reducing resource use.) Some argue that reducing or eliminating beef consumption could mitigate climate change. If all U.S. livestock were removed and every American became vegetarian, greenhouse gas emissions would decrease by only 2.6%. However, beef cattle also provide a sustainable role by converting human-inedible forages grown on marginal land into high-quality protein.
There are two primary types of cattle raised in agriculture: beef cattle, bred for meat production, and dairy cattle, bred for milk production. Common beef breeds include Angus, Hereford, and Charolais, while dairy breeds include Holstein, Jersey, and Brown Swiss.
Cattle gestate for nine months, like humans, and typically give birth to a 70-90 pound calf, which can walk within an hour. Farmers often coordinate calving seasons for efficiency, choosing to calve in either spring or fall. Cow/calf producers care for both mother cows and calves, raising them until weaning. Some farmers raise calves to maturity (feeding out) before selling them for meat production, while others sell calves to specialized feedlot operations.
In feedlots, cattle are fed grain-based, high-energy diets to promote efficient growth. These diets contribute to sustainability—faster growth means less water usage, fewer resources, and lower methane emissions. Iowa leads the nation in number of feedlots, thanks to its abundant corn and soybean supply for cattle feed.
Beef is a nutrient-dense protein source, rich in protein, zinc, and iron. Globally, beef consumption rises with economic growth, making it a valuable commodity across cultures. From cheeseburgers to international dishes like oxtail soup and bobotie, beef plays an essential role in diverse diets.
The beef industry supports a vast array of careers beyond farming and veterinary work, including marketers, food scientists, engineers, truckers/logistical managers, and retail/grocery operators. In Iowa, while only 5% of the population are farmers, 20% work in agriculture, highlighting the many career paths supported in the beef industry.
The capstone of this unit is Activity Five, where students step into the role of marketers. Marketing goes beyond advertising—it involves researching a product, identifying a target audience, and developing a strategic plan to encourage sales. Students will select/create a beef product and form an in-depth plan to successfully market their product. For classrooms interested in an interactive experience, this project can become an interclass marketing contest using the provided High School High Steaks! Rubric.pdf.
Interest Approach – Engagement:
- Have students watch “Utah Beefscapes”, which provides a background on beef cattle.
- Tell students to record their observations and questions while watching the video.
- At the end of the video, ask students how raising cattle in Iowa might differ than the practices used in Utah. Some possible answers include:
- Ranchers/farmers in Iowa usually have smaller amounts of land to graze cattle on.
- More land in Iowa is used for row crops, leading to a smaller percentage of land use for cattle grazing/forage
- In Iowa, cattle travel less distance to reach grazing ground and most are moved by truck and trailer, rather than being herded by cowboys/ranchers on horseback.
- Most cattle in Iowa are ID’d through tags and not brands
- Public lands for grazing are more available in Utah
- Inform students they will be learning more about beef cattle in the next few lessons in the High Steaks! Beef Learning Unit.
Procedures:
Activity 1 – Cattle Genetics
- Have students watch GCSE Biology - Variation and Evolution #68 (youtube.com) (5 minutes) for an introduction into genetic variation. Tell students they will be learning about a specific genetic variation in cattle called double muscling.
- Show slide 2 of the Double the Muscle Powerpoint.pdf. Ask students to study the pictures and list the differences and similarities of each cut of meat.
- Ask students what might cause these differences and if they are caused by strictly genetics or if other factors like type and amount of feed is impacting the structure and amount of muscle. After the discussion, inform students that feed rations do affect cuts of meat and muscling, but what is being observed in the photos is due to the genetics of the cattle.
- Review slides 3-4 to recall pertinent vocabulary. You may need to review some concepts with students to ensure they have a good understanding before moving on to the next steps of the lesson.
- Use slide 5 to explain the role of the gene that produces myostatin. Explain that this gene expresses itself in a trait known as double muscling. Ask students why it might be a good or bad trait for the cattle, consumer, and farmer. Explain to students that they can use math to predict the outcome of a random event like a coin toss or how alleles will segregate during gamete formation.
- Hand out the Double the Muscle Worksheet.pdf, coins, and calculators to each group of 2-3 students. Discuss the procedures and expectations of the lab.
- Read all of page 1 and Activity 1 on the second page of Introduction to the Double Muscle Trait together as a class. Explain that they will be using their coins to represent the random chance of a parent contributing 1 of 2 alleles (represented by heads and tails of the coin).
- Use a coin to illustrate the following as the steps of the activity.
- Step 1: Calculate gametes for the bull.
- Step 2: Calculate gametes for the cow.
- Step 3: Compare the bull and cow results.
- Step 4: Predict offspring genotypes from a mating of a heterozygous bull and cow.
- Step 5: Calculate the probability of each offspring type.
- Step 6: Reflect on the coin tossing results.
- As students begin step 1, draw blank tables on the board for students to fill in their coin toss data from steps 1 and 2 on the worksheet.
- Assist students as needed to calculate the percentage of head and tail flips for the entire class. It is recommended that you work through an example calculation.
- Have students share and compare their findings from steps 1 and 2 in step 3. Help students connect the idea that their equal chance of getting heads or tails in a coin toss is the same probability that happens when gametes are formed and receive one of two alleles. In step 1, the heterozygous bull is just as likely to give the dominant allele as the recessive allele. The same is true for the heterozygous cow in step 2.
- In step 4, students will determine the four possible combinations when 1 allele is contributed from each parent and understand that these combinations represent the potential genotypes of the offspring (DD, Dd, and dd).
- Discuss whether Dd and dD are phenotypically distinct from each other. They are not distinct from each other and the probability of getting heads and tails in any order would be found by adding the 2 separate probabilities (¼ and ¼). Phenotype and genotype probabilities can be illustrated using a sample Punnett square as shown in slide 6.
- For step 5, encourage students to predict how often the DD, Dd, dD, and dd genotypes will be flipped (as a percentage) and decide how many coin tosses should be done as a class to adequately test their prediction.
- Pairs of students will conduct as many coin tosses as needed to feel confident in the genotype probabilities. Have students contribute their data to a class data table on the board.
- Have students calculate the total number of coin tosses completed for the whole class.
- Assist students as needed in calculating the percent coin tosses in Step 5, #5.
- Assuming students conducted a reasonable number of trials, all allele combinations (or genotypes) should have approximately a ¼ chance of being tossed.
- For evaluation, have students complete step 6 on their own. The answer to Step 6, #1 is ¼ and uses the product rule. The product rule states that the probability of independent events occurring together is equal to the product of the probabilities of these events occurring separately. For example, if you tossed 2 different coins simultaneously, the probability of both turning up heads is as follows:

Activity 2: Cattle and Carbon
- Divide students into pairs.
- Prior to class, print one copy of the Carbon Cycle Photos and Captions and cut the images and word strips into separate pieces. Pass out one hexagonal photo or caption to each pair of students. There are 14 photos and eight captions (22 total), so some pairs might get more than one photo or caption depending on the class size.
- Instruct students to create a carbon cycle diagram as a class by placing the photos and captions on the board and drawing arrows between photos and captions. The class may work together to assemble the cycle. Students may use markers to draw more illustrations or add more captions.
- Lead a class discussion on why groups placed their photos in the order they chose. Ask students how each photo relates to carbon.

- Show the video clip Carbon Cycle 3D Video to students. Pause the video as needed to allow students to make changes to their initial cycle on the board. They may need to rearrange photos or add more captions.
- As a class or individually, fill in on the board how each component of the carbon cycle impacts the climate.
- Sunlight/Energy
- Sunlight reaches Earth, warming the surface and atmosphere
- Carbon Dioxide in the atmosphere
- CO2 is a greenhouse gas present in the atmosphere
- It absorbs and re-emits infrared radiation, trapping heat (the greenhouse effect)
- Human activities (burning fossil fuels, deforestation) increase CO2 levels
- Photosynthesis
- Photosynthesis removes CO2 from the atmosphere, acting as a carbon sink
- Carbon sink: A natural system that absorbs and stores more carbon than it releases. Carbon sinks include forests, soil, and the ocean.
- Photosynthesis removes CO2 from the atmosphere, acting as a carbon sink
- Fossil Fuels:
- Burning fossil fuels release stored carbon into the atmosphere
- Animal Respiration
- Animals (including humans) respire, releasing CO2 into the air
- Soil Respiration
- Soil microbes break down organic matter, releasing CO2
- Death and Decomposition
- When organisms die, their organic matter decomposes. The decomposition releases CO2 back into the atmosphere
- Burning of Fuel
- Composition (burning) of fossil fuels, biomass, or other materials releases CO2
6. Explain to students that the amount of carbon on Earth is constant and is like any other chemical element—it is neither created nor destroyed. Carbon is continuously cycled
throughout carbon reservoirs such as the earth, atmosphere, ocean, and living organisms. Carbon atoms then combine with other atoms to create greenhouse gases like carbon
dioxide and methane. Greenhouse gases trap the sun’s heat in the Earth’s atmosphere which contributes to climate change.
- Bring students’ attention to the cows on the carbon cycle.
- Ask students how cows contribute to the carbon cycle. (Cows produce methane. Greenhouse gas emissions from cattle account for two percent of U.S. greenhouse gas emissions. Cattle grazing encourages the presence of grasslands which act as a carbon sink.)
- Assign students to groups and have them investigate how different methods/combination of methods of raising cattle (grass-fed and finished, grain-finished, feedlots, etc.) impact the carbon cycle in different ways. Have students compare and contrast each method including advantages and disadvantages.
- For evaluation, have students write a summary of which method of raising cattle they think is “best” and why.
Activity 3: Global Food Networks
- Have students read Iowa Ag Today middle school Issue 1, page 6.
- Note: Physical copies of Iowa Ag Today are available for educators across Iowa. Request copies by emailing info@iowaagliteracy.org.
- Go through the Lesson 3 Powerpoint - Farming Around the World.pptx together as a class.
- While displaying slide one, ask your students where their food is produced (farms). Next, ask them where farms are located (worldwide). Explain that in the United States we have a plentiful food supply with a large variety of foods. At our grocery stores, we can purchase fresh produce year-round through our domestic production and international trade.
- On slide two, ask students if every country throughout the globe has the same factors influencing their food supply. Ask questions such as:
- How do farms vary throughout the world?
- What crops are grown in which areas or countries?
- What animals are raised?
- Do farming practices vary? Why?"
- Brainstorm and record student answers to the questions above.
- Give each student a copy of the Farming Around the World handout. Using the handout, explain to students how the following six factors impact food production in various parts of the world. Students will take notes throughout the discussion on the following key factors:
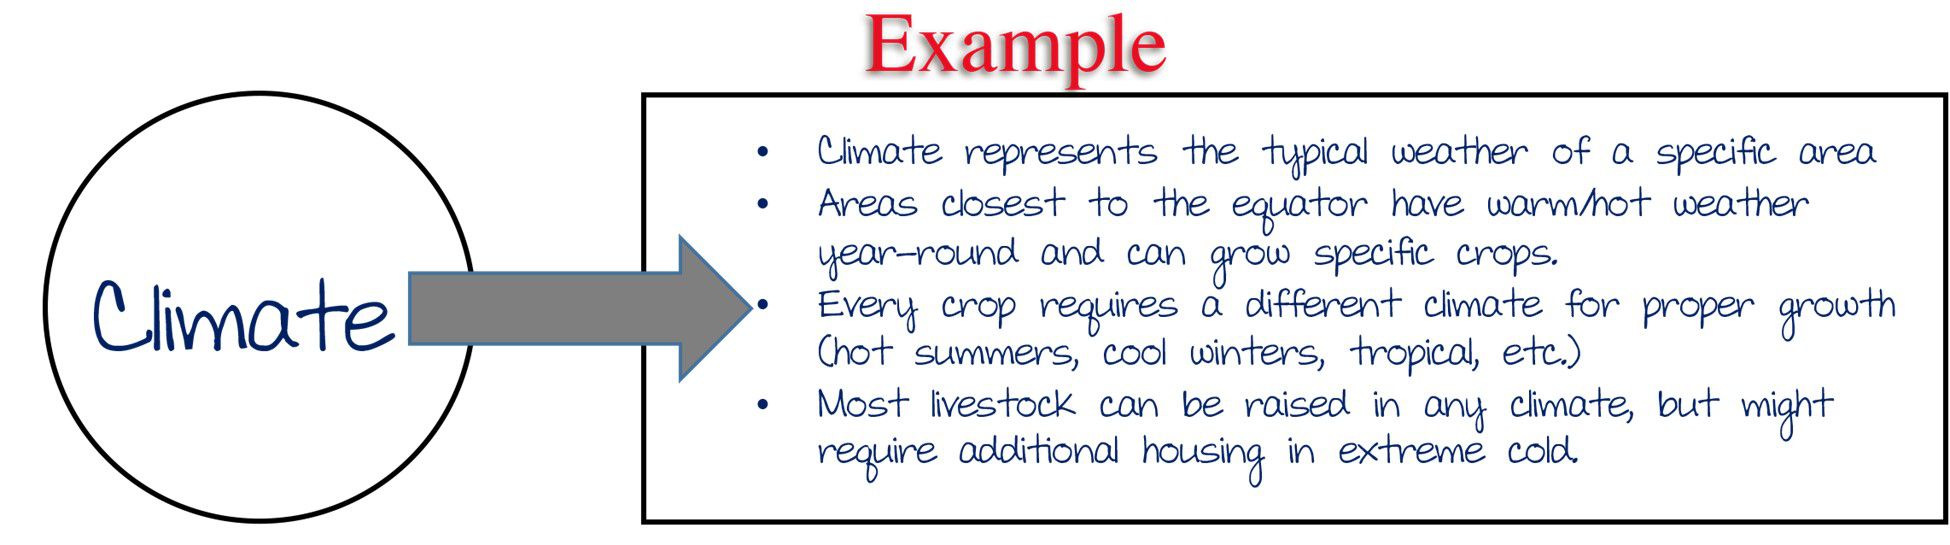
- Climate (Slide 3): Climate plays a large part in a farmer's ability to grow crops and raise the livestock that provide our food. Climate refers to the weather and seasons in a given area. Factors such as the length of a growing season and temperature are critical to successful crop growth and harvest.
- Open space (Slide 9): Whether growing crops or raising livestock, farmers need open space to farm. Some countries have ample open space and others have little open space with high populations creating difficulty to provide food for their own population.
- Soil Quality (Slide 12): Not all land has arable soil, or soil that is suitable for crop growth. Some soils are too sandy or contain too much clay and don't hold adequate nutrients or proper water drainage or absorption. Other soils may not be suitable to grow crops such as fruits, vegetables, and grains, but they are suitable to grow grasses which provide feed for livestock.
- Water Availability (Slide 14): Water is a limited natural resource that is necessary to farming. Too much or too little water can be detrimental to a farm. Water requirements vary by crop.
- Available Technology (Slide 16): Farming requires a great deal of physical labor. Technology and machinery help to ease this burden and allow a farmer to produce more food. However, in some countries, particularly Third World countries, they may not have access to these advancements or may not be able to afford them. Technology also allows for food to be transported longer distances and preserved for later use.
- Economics and Government (Slide 18): Forms of government such as capitalism and socialism impact farming. Government policies may encourage or discourage farm production. Market pricing of agricultural crops, government subsidies, and regulations applied to farming practices may all impact farming in a positive or negative way.
- Distribute the USDA’s “Cattle & Beef – Sector at a Glance” and the “Distribution of Beef Cattle and Pasture/Rangeland in the Continental U.S.” map.
- Instruct students to answer the following questions by applying the concepts learned in the “Farming Around the World” PowerPoint and reviewing the cattle sector resources given. Note: The distribution map is dated (2009), but the general trends of cattle distribution are still similar in the US.
- What areas of the US raise the most cattle?
- How are these areas similar?
- How are they different?
- What factors influence where cattle are grown in the US?
- How does the import/export of cattle impact the cattle sector?
- Which countries are the primary trade partners of the US cattle industry?
- What areas of the US raise the most cattle?
- In discussion or as an exit ticket, ask students how our diets would change if we only ate food produced in our state.
Activity 4: Beef Nutrition
- Project the Meat or Meatless PowerPoint on the board. Show slide 1 with four photos of different burgers.
- Instruct students to evaluate each burger and try to correctly match the picture to the type of burger it is. Once students have selected their matches, have them prepare supporting statements and reasonings for their choices.
- Using random selection, ask students to share their guesses and reasonings with the class.
- Consider asking the following questions to lead a class discussion as students offer their reasonings:
- What qualities of the burger did you consider when studying each burger?
- Was there one burger that was easy or obvious to identify?
- Which burger would you be willing to try?
- Reveal the correct burgers (slide 2) to the students (Did anyone guess all four correctly?) and discuss similarities and differences between the four burger options.
- Ask the following questions to lead a class discussion:
- Do you think all four burgers (patties) taste the same?
- The Impossible Burger is plant-based, but well-known for “bleeding” like a real beef patty. Why is that?
- How does each meat compare nutritionally? (more info on slide 7)
- Inform students that they will explore meat and meat alternatives in order to determine similarities and differences between the two.
- Using slides 3-7 of the PowerPoint, review each of the burgers including how it is made, the contents of each, and unique features. Have students note the nutrition information available for each burger.
- Write the numbers 1-6 on a beach ball.
- Now, stand in the middle of the room and hold the ball up for your students to see. Without rotating the ball, ask students in various points of the room which numbers(s) they can see. For example, ask a student in the front of the classroom what number he or she sees, followed by the same question to a student in the back of the room and so on. Each student will see all or part of different numbers.
- Ask your students, “Why, if you are all looking at the same object (the ball), are you seeing different numbers?” Explain that it is because each has a different “point of view.” Each student sees different numbers from their point of view. They may see an entire number or part of a number. There will be some numbers that they do not see at all.
- Use this object lesson to spring into a discussion about plant-based burgers and beef burgers.
- Ask students, “What different points of view should be considered when discussing plant-based burgers and beef burgers? How could this be a controversial topic?”
- Allow students to share and discuss different points of view related to plant-based protein and traditional beef.
- While holding the ball in the middle of the room, divide students into six groups based on where they are sitting. Ask each group which number they see best from their position in the classroom. The number that they see will be their assigned point of view. For example, if a group sees the number two best from their position in the classroom, they will have card #2 and their point of view will be a beef producer.
- Using the Plant-based Protein Point of View cards, assign each group a point of view to consider.
- Instruct groups to study the information on their card and discuss their point of view as a group. What other facts and information could be added to support their point of view? Groups should research their point of view and find various artifacts (e.g. video clips, news articles, opinion articles, etc.) that would help defend their point of view in a presentation or class discussion. Note: If time is short, use the information on the card to give them the baseline information needed.
- Allow students to present their material (point of view) to the class or set up your desks for a classroom discussion on each of the different points of view. As each group presents or discusses their point of view, remind students of the following:
- It’s okay to agree to disagree.
- When looking at or discussing issues, people may use facts, opinions, or personal biases to defend and persuade others to see her or his point of view.
- Resolving issues and evaluating situations requires that we look at the viewpoints of others to arrive at workable solutions, to form realistic conclusions, or to make our own evidence-based decisions.
- Review and summarize the following key points:
- Beef and the ingredients contained in plant-based burgers are produced on farms.
- The production of all food requires the use of natural resources such as arable land, water, and soil nutrients.
- Food production systems are influenced by consumer choices.
- There are many points of view to consider when comparing beef and plant-based burgers. Topics of consideration include ethics, available natural resources, nutrition, and food safety.
Evaluate
Activity 5: Beef Marketing
- Ask students to think of their last trip to the grocery store. What made them choose one food item over the other? Answers might include:
- Price
- Perceived Value
- Appealing Packaging
- Nutritional Aspects
- Convenience
- Explain to students that marketing is the process of creating and communicating offerings that have value for customers and clients aimed at attracting and retaining customers. With this definition in mind, ask students what they think a beef marketer does. Possible answers might include:
- Identifying target consumers
- Highlighting health benefits of beef (high in zinc, iron, protein)
- Developing new products
- Designing branding and packaging
- Creating advertising strategies
- Inform students they will be developing a marketing plan for a beef recipe/product of their choice.
- Divide class into groups of 3-5 and provide students with an overview of the project. Each group will complete the items listed below. A successful project will be supported by appropriate and compelling research for all marketing decisions.
- Decide on their beef recipe/product (can be create a new product or use a preexisting one)
- Identify their key sales demographic
- Determine the nutrition profile of their product
- Create a plan for packaging and selling their product
- Devise an advertising campaign for the product
- Optional: Give students a mock budget from “their company” to adhere to. Alternatively, have students start as entrepreneurs and estimate costs needed to launch a product.
- Once groups have developed their marketing plans, allow them to “market” (present) their product to the class. Projects may be judged in a class wide competition.
- Projects may be scored using the official High School High Steaks! Rubric.pdf.
Note: The Iowa Agriculture Literacy Foundation is no longer hosting a statewide contest, but finished projects may be sent in for feedback from IALF’s team.
Did you know?
- Iowa has the nation’s 7th largest cattle inventory.
- Iowa has more cattle feedlots than any other state in the U.S.
- Cattle are ruminant animals, meaning they have a four-compartment stomach.
Extension Activities:
- Explore the USDA Food Quality Labels PDF. Have students learn more about the different labels and their terminology.
- Have virtual (Zoom, Google Hangout, etc.) class conversations with industry professionals, like farmers, veterinarians, marketers, advertisers, food scientists, butchers, or more.
- Explore these FarmChat style videos
- The Meat Science Behind Beef: Processing to Plate – Students will learn why beef looks the way it does, how beef is graded, and how muscles are used to create different cuts. The session focuses on helping students understand why cuts vary and how these differences connect to quality and everyday meals.
- Inside a Beef Packing Plant-Beef: Processing to Plate – Students will learn the steps involved in processing beef, and the practices used to support food safety and consistency. Students will understand how beef moves through the facility and the care taken at every step.
Suggested Companion Resources:
- My Family’s Beef Farm by Katie Olthoff
- Beef Nutrition Information from Cattlemen’s Beef Board
Sources/Credits:
- Double the Muscle: Probabilities and Pedigrees
- The Carbon Cycle (nasa.gov)
- The carbon cycle (article) | Khan Academy
- The carbon cycle (article) | Ecology | Khan Academy
- Carbon Hoofprints: Cows and Climate Change | Iowa Agriculture in the Classroom (agclassroom.org)
- A Tale of Two Burgers: Beef and Plant-based Protein
Author:
Madison Smithson
Organization Affiliation:
Iowa Agriculture Literacy Foundation
Agriculture Literacy Outcomes:
- T1.9-12.h Understand the natural cycles that govern the flow of nutrients as well as the way various nutrients (organic and inorganic) move through and affect farming and natural systems
- T2.9-12.a Compare and contrast the difference between nature’s plant and animal lifecycles with agricultural systems (e.g., producers manage the lifecycle of plants and animals to produce a product for consumption)
- T2.9-12c Discuss reasons for government’s involvement in agricultural production, processing, and distribution
- T4.9-12.d Evaluate the benefits and concerns related to the application of technology to agricultural systems (e.g., biotechnology)
- T4.9-12.e Identify current and emerging scientific discoveries and technologies and their possible use in agriculture (e.g., biotechnology, bio-chemical, mechanical, etc.)
- T5.9-12.d Describe essential agricultural careers related to production, consumption, and regulation
- T5.9-12.e Discuss how agricultural practices have increased agricultural productivity and have impacted (pro and con) the development of the global economy, population, and sustainability
- T5.9-12.i Explain the role of government in the production, distribution, and consumption of food
- T5.9-12.h Explain how comparative and absolute advantage in agriculture impacts supply and demand in relation to trade
- T5.9-12.j Provide examples of how changes in cultural preferences influence production, processing, marketing, and trade of agricultural products
Iowa Core Standards:
Science
- HS-LS3-2. Make and defend a claim based on evidence that inheritable genetic variations may result from: (1) new genetic combinations through meiosis, (2) viable errors occurring during replication, and/or (3) mutations caused by environmental factors.
- HS-LS3-3. Apply concepts of statistics and probability to explain the variation and distribution of expressed traits in a population.
- HS-LS4-3. Apply concepts of statistics and probability to support explanations that organisms with an advantageous heritable trait tend to increase in proportion to organisms lacking this trait.
- HS-ESS2-4. Use a model to describe how variations in the flow of energy into and out of Earth’s systems result in changes in climate.
- HS-ESS2-6. Develop a quantitative model to describe the cycling of carbon among the hydrosphere, atmosphere, geosphere, and biosphere.
Social Studies
- SS.9-12.3. Gather relevant information from multiple sources representing a wide range of views while using the origin, authority, structure, context, and corroborative value of the sources to guide the selection.
- SS.9-12.4. Evaluate the purpose and credibility of sources by examining how experts view the source.
- SS.9-12.6. Construct responses to questions using logical reasoning, accurate sequence, and relevant examples and details.
- SS.9-12.7. Construct clear and coherent arguments that support a specific claim, using relevant evidence and reasoning from multiple credible sources to substantiate the claim.
- SS.9-12.Econ.12. Explain why individuals, businesses, and governments trade goods and services and how trade affects global economies.